The State of Food Insecurity

Higher Use and Higher Need

In 2025, 40% of Massachusetts households—approximately 1.1 million (out of a total of 2.8 million households statewide)—experienced food insecurity at some point over the past 12 months. Very low food security—the most severe form, indicating the experience of food insecurity with hunger—is on the rise. In fact, approximately 700,000 households in 2025 experienced very low food security.

Regional Household Food Insecurity Map

Unfortunately, households with child-level food insecurity were also on the rise this past year, up to 37%, compared to last year when there was a slight decrease to 33%. However, very low food security among children—when a child must skip meals or not eat for the whole day due to insufficient food—has stabilized.

These trends reflect the lingering impacts of the COVID-19 pandemic, the ongoing affordability crisis—particularly the rising costs for food, housing, and utilities—and two distinct shifts in public nutrition policy: first, the expiration of pandemic-era increases and flexibilities to food and nutrition assistance programs, and second,1,2 the recent changes to SNAP eligibility enacted in 2025.3

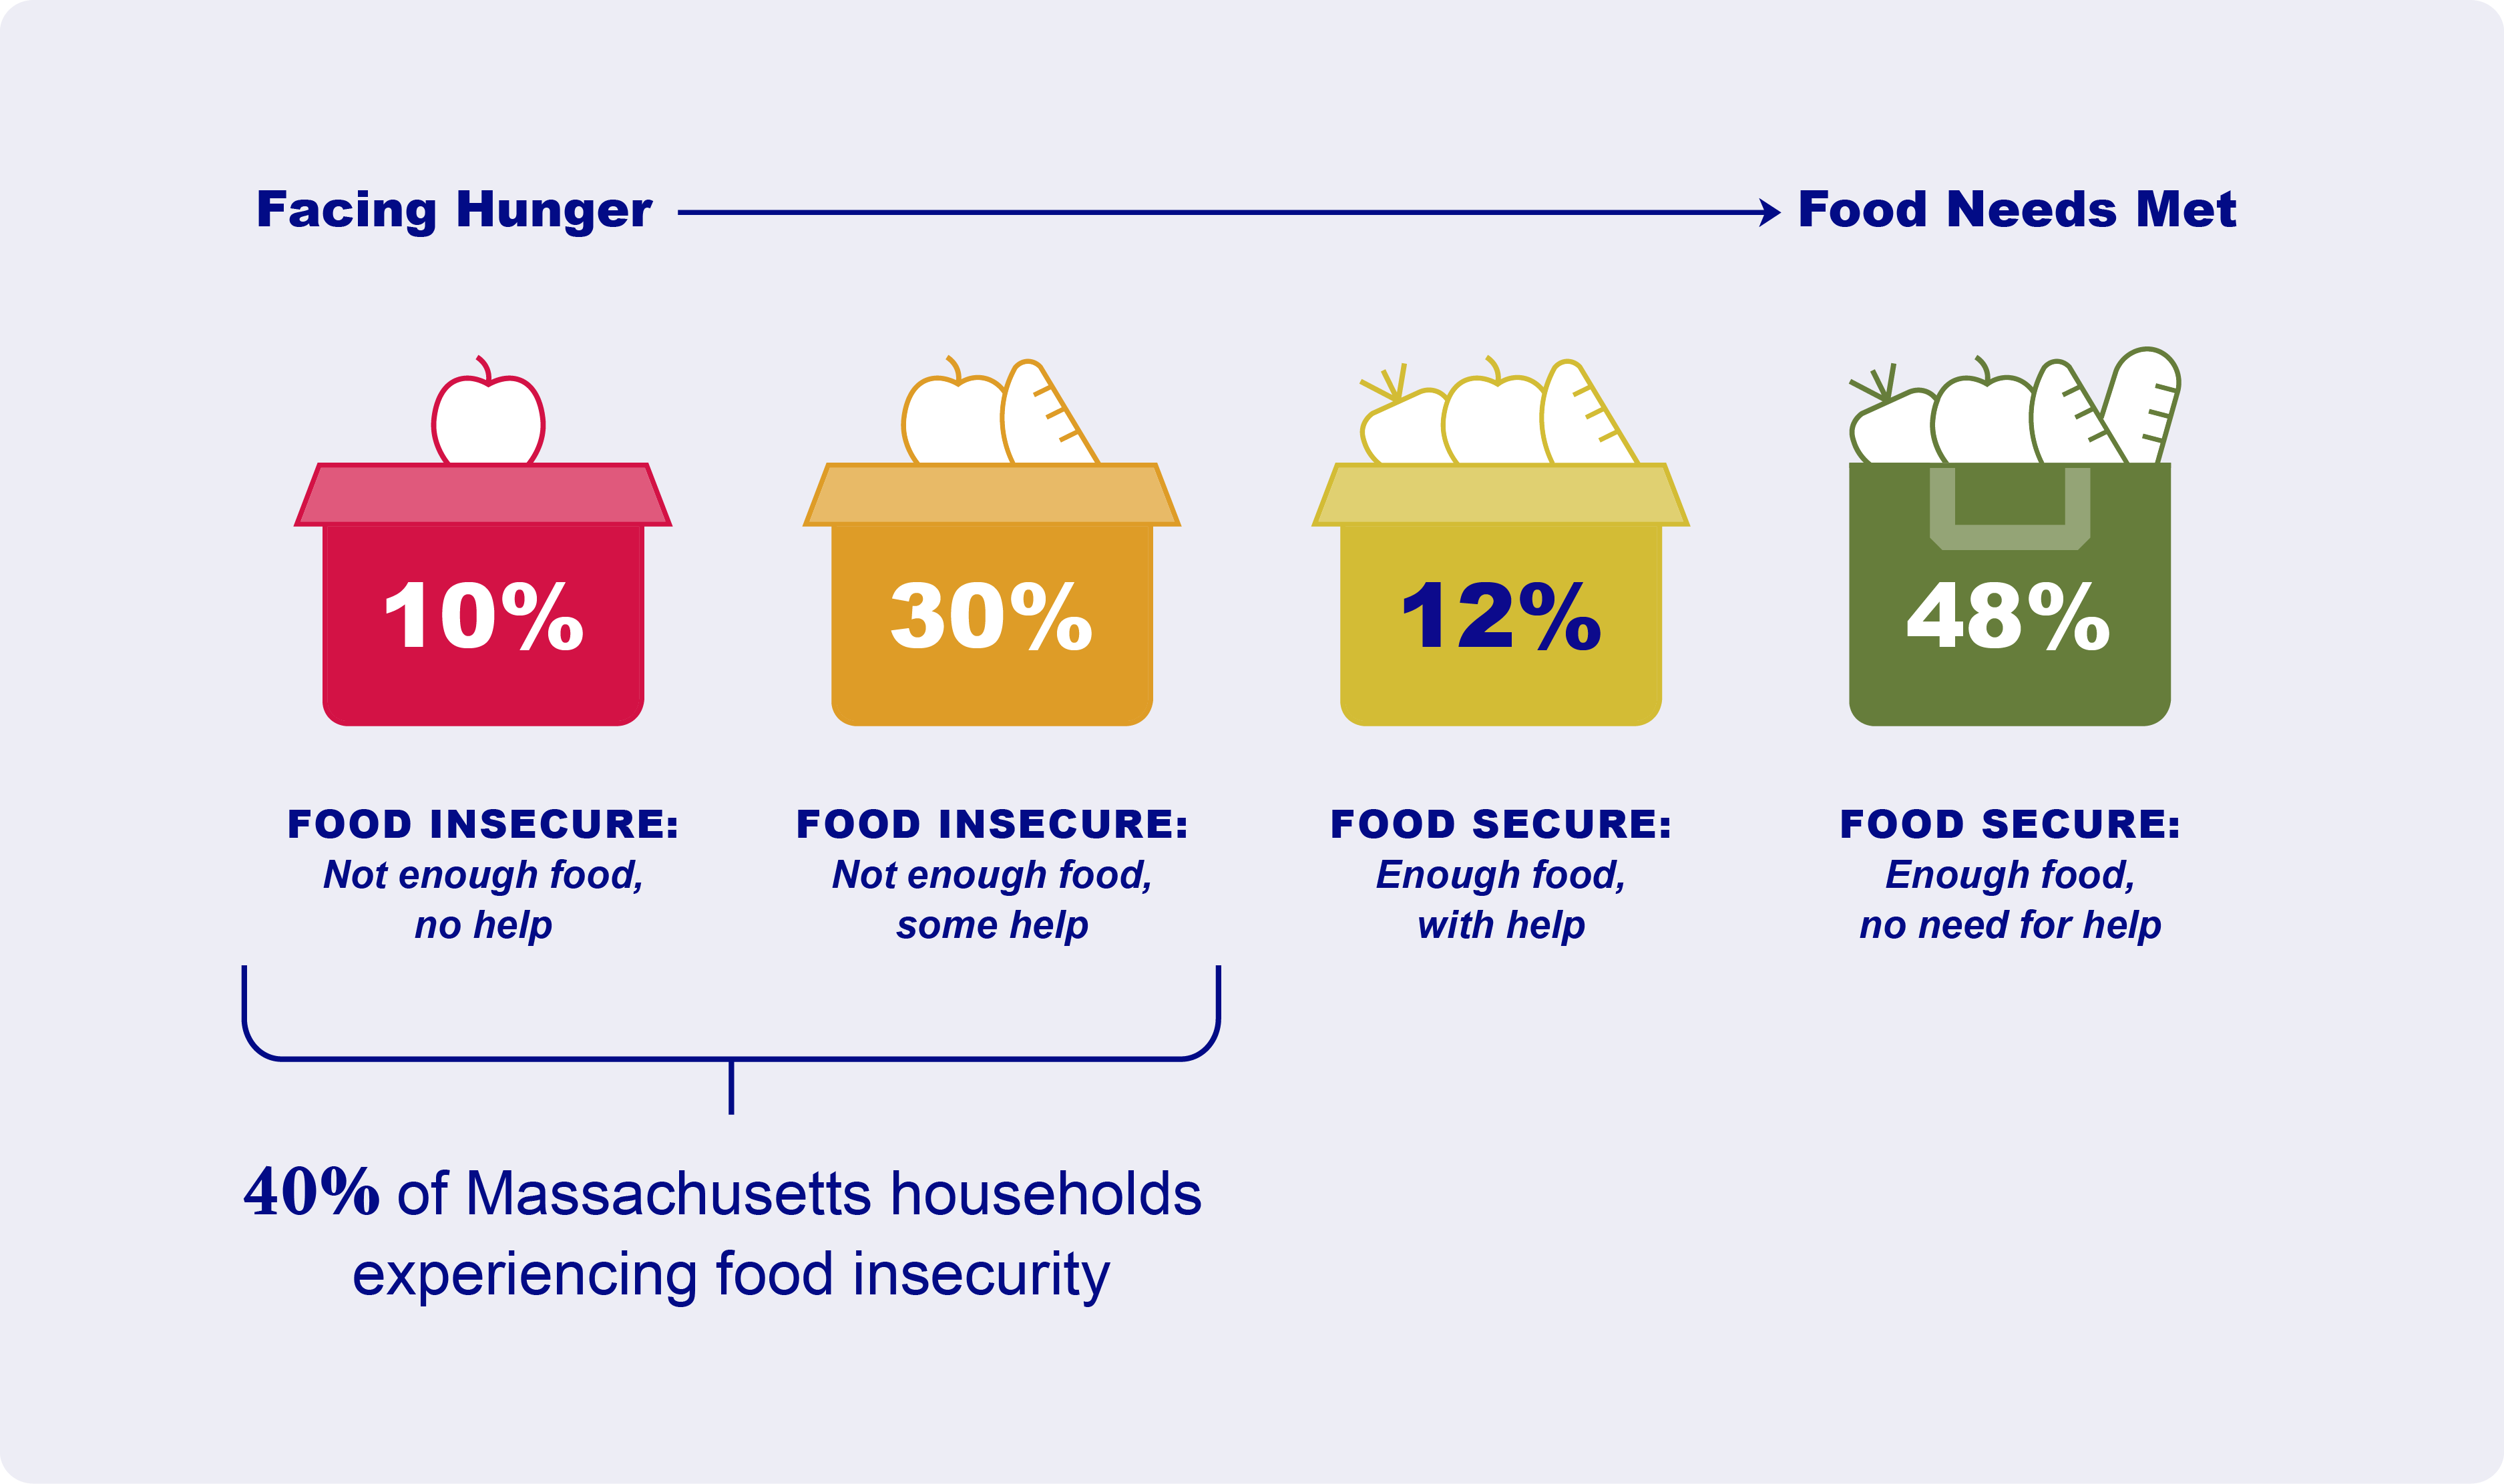
Household and Child-Level Food Insecurity

*2019–2021: measured using the 6-item USDA Household Food Security Survey Module (adult-level)
**2022–2025: measured using the 18-item USDA Household Food Security Survey Module (household-level). Beginning in 2022, child-level food insecurity was measured using the 18-item USDA Food Security Survey Module.

Communities at Risk

While we’ve seen significant increases across every demographic, these challenges aren’t equally distributed. Hispanic households have consistently experienced the highest rates of food insecurity during the past six years, with levels reaching 63% in 2025. While seniors have historically reported lower rates of food insecurity, with approximately ¼ of the state’s population 60 or older, 1 in 3 experienced food insecurity in 2025.

Demographics of Household Food Insecurity

*2019–2021: measured using the 6-item USDA Household Food Security Survey Module (adult-level)
**2022–2025: measured using the 18-item USDA Household Food Security Survey Module (household-level). Beginning in 2022, child-level food insecurity was measured using the 18-item USDA Food Security Survey Module.
Note: Native American/Alaskan, Other, or Mixed Race data were obtained but not included due to small sample sizes. Please reach out for more information.

*2019–2021: measured using the 6-item USDA Household Food Security Survey Module (adult-level)

**2022–2025: measured using the 18-item USDA Household Food Security Survey Module (household-level). Beginning in 2022, child-level food insecurity was measured using the 18-item USDA Food Security Survey Module.
✤ Small sample sizes
† Public and community college students

‡ Limited to those attending college with income <$100K

¶ Among individuals aged 65 years and older

§ Among individuals aged 60 years and older

A Model for Understanding Food Insecurity

Food insecurity is a complex economic, social, and policy challenge that affects families in different ways and at different points in time. In Massachusetts, a wide range of food and nutrition assistance programs help households navigate periods of instability.

To better understand how families experience hunger and interact with food and nutrition assistance programs, Second Harvest Heartland, a member of the Feeding America network, first developed what is now called The Hunger Continuum. It is a framework that captures not only whether households are experiencing food security or insecurity, but how effectively available supports meet their needs over time.

Where Massachusets Households Fall on the Continuum

Food insecurity is not a static condition. In 2025, more than half of households (52%) in Massachusetts were either experiencing food insecurity or may have used a food and nutrition assistance program (including SNAP, WIC, MassHealth Nutrition Supports, or charitable food and nutrition programs). Since school meals are accessible to everyone, they were not included in the Hunger Continuum measurement. This finding reinforces that food security fluctuates as households respond to rising costs, changing income, and shifting access to various food and nutrition assistance programs.

30% of households may have experienced food insecurity despite receiving food and nutrition assistance, demonstrating that while these programs are essential, benefit levels and funding are often insufficient to move families to food security. At the same time, 12% of households may have been experiencing food security with the help of food and nutrition assistance programs, underscoring the critical role these programs play in helping families meet their food needs.

In contrast, only 10% of households experienced food insecurity without receiving any food or nutrition assistance. This relatively small share highlights Massachusetts’s strong outreach, infrastructure, and access to food and nutrition assistance programs. Together, these patterns show that the Commonwealth has built an effective system for connecting families to support—but that strengthening and fully funding these programs is essential to ensure that access translates into lasting food security.

Nutrition Security

The ability to afford healthy foods is called nutrition security, and it is measured through both adult and child dietary quality. Households with food insecurity reported eating similar amounts of unhealthy foods compared to their food secure counterparts. However, they eat less foods that are healthy, compared to their food secure counterparts, likely due to the increased cost of healthy foods.

Among households experiencing food insecurity in Massachusetts, 57% reported low nutrition security—or difficulty affording healthy foods—an increase from 51% in 2022.
"Affordable food often means highly processed options; accessing fresh produce is harder."
White mother; SNAP, WIC, and food pantry participant; Worcester County
1

Wells, W., Jackson, K. E., Leung, C. W., & Hamad, R. (2024). Food insufficiency increased after the expiration of COVID‑19 emergency allotments for SNAP benefits in 2023. Health Affairs, 43(10), Article 2023.01566. https://doi.org/10.1377/hlthaff.2023.01566

2

Children’s HealthWatch Team. (2024, September 12). With child poverty on the rise, 2025 offers a key opportunity to expand the Child Tax Credit. Children’s HealthWatch. https://childrenshealthwatch.org/with-child-poverty-on-the-rise-2025-offers-a-key-opportunity-to-expand-the-child-tax-credit/

3

Massachusetts Executive Office of Health and Human Services. (2025). November 2025 SNAP updates. Mass.gov. https://www.mass.gov/info-details/november-2025-snap-updates